
Oregon's Wildfire Pandemic
Introduction by Jim Petersen Bob Zybach and I have been friends and co-conspirators since we put him on the
Introduction by Jim Petersen Bob Zybach and I have been friends and co-conspirators since we put him on the


Two organizations, a shared principle, and a growing conversation about America's wildfire crisis. First, Put Out The Fire.
Two organizations, a shared principle, and a growing conversation about America's wildfire crisis. First, Put Out The Fire.

Introduction by Jim Petersen
Bob Zybach and I have been friends and co-conspirators since we put him on the cover of Evergreen magazine in March 1994. He was then a graduate student in the College of Forestry at Oregon State University.
While working toward his master's degree, Zybach assembled a 101-page critique of the assumptions underlying the Clinton administration's 1993 Forest Ecosystem Management Assessment Team (FEMAT) report, which helped shape the Northwest Forest Plan adopted in 1994, titled Forest History and FEMAT Assumptions.
In a subsequent interview, I asked Bob where he got all of the information he found that challenged the old-growth-spotted-owl assumptions of scientists who insisted they could find no evidence of the human and natural forces that have shaped and reshaped the Douglas-fir region for eons.
The scientists argued that preserving what remained of the region's old-growth forests was essential to the survival of the northern spotted owl.
“Oh, that's easy,” Bob replied. “I have a library card.”
His laconic reply challenged the assumptions of Clinton's scientific team, but the L-shaped dining and living room in the small house he was renting in Corvallis, Oregon, was filled with boxes stacked three high, containing reports he had photocopied in the research library at Oregon State University.
In our view, the FEMAT report rested on deeply flawed assumptions that Bob's research challenged. The resulting Northwest Forest Plan fundamentally changed how millions of acres of federal forests would be managed.
We are still living with the consequences of those forest management decisions, while wildfires have destroyed substantial areas of mature forest and spotted owl habitat.
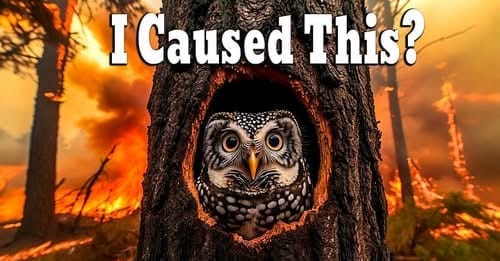
Barred owls bear a striking resemblance to spotted owls, though they are slightly larger and more adaptable. Scientists have documented competition between the species, along with occasional crossbreeding. To “save” spotted owls, the U.S. Fish and Wildlife Service has approved a plan that could result in the killing of as many as 450,000 barred owls over the next 30 years.
Why?
Barred owls were already expanding into spotted owl territory long before the northern spotted owl was listed as threatened in 1990. Their presence was documented, and the Fish and Wildlife Service acknowledged the potential threat they posed.
Yet a 2024 discussion document prepared by a subcommittee of the U.S. Forest Service's Northwest Forest Plan Federal Advisory Committee states that the barred owl's presence and impact were not known to scientists and planners when the Northwest Forest Plan was developed. But the U.S. Fish and Wildlife Service's own documentation confirms that barred owl competition had already been identified as a potential threat in the 1990 listing decision.
How can those statements be reconciled?
Yet the forest management policies that followed focused primarily on preserving old-growth habitat, severely restricting timber harvest across millions of acres of federal forests.
Was the growing influence of barred owls adequately considered, or was it given too little weight in a scientific assessment that provided the foundation for sweeping restrictions on forest management?
Consider what happened next. A U.S. Forest Service report covering the first 25 years of the Northwest Forest Plan found that suitable spotted owl nesting and roosting habitat on federal lands actually increased by 3%, while territorial spotted owl populations declined by an estimated 61.8%. The report identified barred owl competition as a primary cause.
Meanwhile, that same report documented 703,700 acres of spotted owl nesting and roosting habitat lost to wildfire between 1993 and 2017, nearly three times the acreage lost to timber harvest.
How much weight has that destruction received in explaining the spotted owl's decline?
Now, decades later, the federal agencies involved in shaping those original forest policies are advancing an entirely different solution: killing the competing species.
The Fish and Wildlife Service reports that experimental barred owl removal has improved spotted owl survival in selected areas. But the agency also has a responsibility to demonstrate that the results can be sustained across a vast landscape for decades.
The barred owls continue to migrate. Occasional hybridization complicates identification. Removal requires trained specialists, continued monitoring, and significant resources.
What happens when the killing stops?
How much will it cost to maintain these results?
Who independently evaluates the long-term success of a program developed and overseen by agencies invested in the original conservation strategy?
How much weight did scientists give barred owl competition when developing the 1993 FEMAT recommendations, and would the resulting forest management policies have looked different had that threat been more fully understood?
Are we now attempting to correct an earlier failure to account for a critical variable by removing that variable from the ecosystem?
You don't kill the variable to make the science work. You examine the assumptions, account for the evidence, and reconsider the conclusions.
Enter a second co-conspirator: Dave Sullivan, PhD, Professor Emeritus at Oregon State University. He taught in the College of Business at OSU for many years and has been a leading advocate for active management of state-owned forests, especially the Elliott.
When Oregon entered the Union in 1859, Congress granted the state nearly 3.4 million acres of land for the support of public schools.
The promise was clear: these lands were intended to generate revenue for public education.
The Elliott was one of those forests. In 2022, before Governor Tina Kotek took office, Oregon released the Elliott from its obligation to generate revenue for schools after paying $221 million into the Common School Fund.
But the larger question remains. What happens when productive forests that once generated revenue for public education are placed under management policies that emphasize preservation and research instead?
In our view, the Kotek administration's approach to state forest management continues a troubling shift away from the economic and social benefits these forests were intended to provide. Rural communities, their schools, and future generations have a great deal at stake.
This brings us to Bob's current essay.
It builds on an earlier essay that appeared in the Oregon Fish & Wildlife Journal that has caused quite a stir in rural Oregon.
Using AI, Bob and Dave assembled a series of maps and databases that track the size and frequency of wildfires in Oregon from 1950 to 2026. Many of you will not be surprised to learn that their data show wildfires were much smaller, less destructive, and less frequent than they are today. The contrast between those earlier fires and today's large conflagrations is striking.
Data sets for the kind of work Bob and Dave did in Oregon exist in different formats for every state in the United States. Some date back more than 100 years. Others less so. We hope to assemble maps similar to the ones you see here for every state.
Stay tuned.
By Bob Zybach
I have been working with Dave Sullivan and AI on an ORWW Oregon wildfire mitigation project, with fellow board members Russ Sapp and Rob DeHarpport. One of my first learning projects was to see if I could use AI to construct maps with GIS layers.
I did four sample counties (Lane, Curry, Deschutes, and Malheur) with wildfires larger than 1,000 acres for the years 2020-2026, and the entire state for the same years, but for fires larger than 10,000 acres. The results were very good - even a little astonishing - and a second or third draft was sent to the others for informal review. Rob was likewise as impressed as I was and asked if historical Oregon fires could likewise be mapped.
The four maps shown here are the result. The originals are 11 x 17 inches, contain detailed legends and technical references, and each line goes to the named fire and the year it occurred. A report of more than 30 pages summarizes everything in text and tables. There are certainly a handful of errors and omissions, such as the missing 1951 Tillamook Reburn - this is only the second draft - but it is based on the best currently available state, county, and federal records.
With greatly increased wildfire funding and improved record-keeping over the past 10-40 years, these fires are mapped and summarized by county and by acreage since 1950. Newer listings also include suppression costs, and whether fuels were grass, brush and hardwoods, or conifers. All sources and questionable data (and why) are clearly identified.
The same minimum fire size of 10,000 acres was used for all four historical maps and the comparisons that follow. I would set the technical accuracy at least 90%, and I believe the documented trends in fire size, frequency, and cost are unmistakable.
These figures are based on the best available historical records. Earlier records are less complete than contemporary records, some known omissions remain, and the 2026 figures are preliminary and subject to revision.
I selected these periods based on my knowledge of Oregon's fire history and was surprised to find that the three most recent periods each contained between 99 and 102 major fires, despite representing progressively shorter intervals.
Protecting people, land & property from the devastation of wildfires.
We don’t back down when the mission is daunting; we’re in until the fire is out.
There are no reliable wildfire suppression costs before the mid-1990s. Major wildfires were infrequent, in part because of rapid suppression efforts by local loggers, rural fire districts, volunteers, and seasonal forest workers, reflecting the philosophy of the old 10 AM policy - work through the night to get a wildfire out by 10 AM in the morning. If that couldn't be accomplished, then by 10 AM the following morning, and so on, until the fire was out and kept relatively small.
For 1990-2009, good records are available for 34 of the 102 major wildfires during those years. This represents 1,675,000 acres burned during those 20 years, at a documented suppression cost of $464 million, or $277 per acre.
Suppression records for the 2010-2019 decade exist for 78 of the 99 total fires, although there is some concern about the accuracy of the suppression cost reported for the 24,000-acre 2017 Milli Fire. Excluding Milli, the available records account for 4,529,000 acres burned at a documented suppression cost of $916 million, or $202 per acre.
From 2020-2026, we have 97 records for the 100 fires, with 2026 records likely to be adjusted in coming months. Suppression costs for 7.015 million acres burned were $3.683 billion, or approximately $525 per acre.
Note: "acres burned" does not include property losses, timber losses, rehabilitation, or other consequences.
This identification is important when considering the land management policies of different ownerships, and how that can affect local politics, government authority, business opportunities, schools, roads, and wildfire risk, including air and water quality and recreational opportunities.
From this it can be quickly determined that Curry County is mostly green and had extremely serious wildfire problems from 1987 through 2010, and continued to experience major wildfires afterward, including the 2017 Chetco Bar Fire and the 2018 Klondike Fire.
Malheur County is almost entirely brown and has had large-scale grass and shrubland fires regularly over time; Wasco and Jefferson Counties contain a significant amount of the State's Tribal lands, and they have experienced serious wildfire problems for the past 30 years.
The predominantly blue counties of Clatsop and Tillamook operate under an entirely different set of policies and regulations than other Oregon counties. They show relatively few major fires after the 1951 Tillamook Reburn. In my view, that record reflects, in part, decades of salvage logging, milling, reforestation, and active forest management following the "Great Fires" of the 1860s, 1910, and the 1933-1951 Tillamook fires.
As a result, they have largely contained young second growth and plantations for several decades, and much of the fire-killed timber from those earlier burns was salvaged or decomposed long ago.
So enough trends and numbers.
The purpose of the ORWW Wildfire Mitigation Project is to draw close attention to the deadly, ugly, and costly mess our public forests have become over the past 40 years, and hopefully through public awareness and student education, repair this damage and leave a beautiful and productive environment for future generations.
For those of us old enough to remember, our parents and grandparents left us a wonderland of good schools, beautiful forests with unlimited recreational opportunities, abundant good-paying jobs where experience and work ethic counted far more than a diploma, clean water, fresh air, and far fewer large wildfires.
It's only right that we do the same for future generations. There is a lot of work that needs to be done, but the rewards are almost immediate and can last for generations.
Your 100% tax-deductible subscription allows us to continue providing science-based forestry information with the goal of ensuring healthy forests forever.